How it works / Ergonomics
More accurate, proactive risk assessment
Traditionally, ergonomics has been handled as an assessment: you observe, interview, take spot measurements, document, and make decisions based on that. This has been practical and established, but with one limitation: when the basis is sparse, conclusions often become a mix of experience, assumptions, and generalisations.
Data-driven ergonomics management is built on a different logic: strain, risk, and improvement are rarely “states” captured in isolated observations, but patterns that emerge over time. Ergonomic risks build up through combinations of:

Frequency
(how often)

Duration
(how long)

Intensity
(how heavy /
how unfavourable)

Variation
(recovery, micro-breaks)

Context
(station, task, pace, aids)

Don’t ask “what does it look like?” — start asking “how does it behave over time?”
This means that the “right answer” is rarely found in a spot measurement — it is found in distributions, trends, and recurring peaks. Digital ergonomics management therefore turns ergonomics into a feedback loop: you stop asking “what does it look like?” and start asking “how does it behave over time — and what happens when we change something?” This is the only reasonable path if ergonomics is to be managed as professionally as quality, production, and safety: with measurable outcomes and verified effect.
A complementary tool for all work environment developers
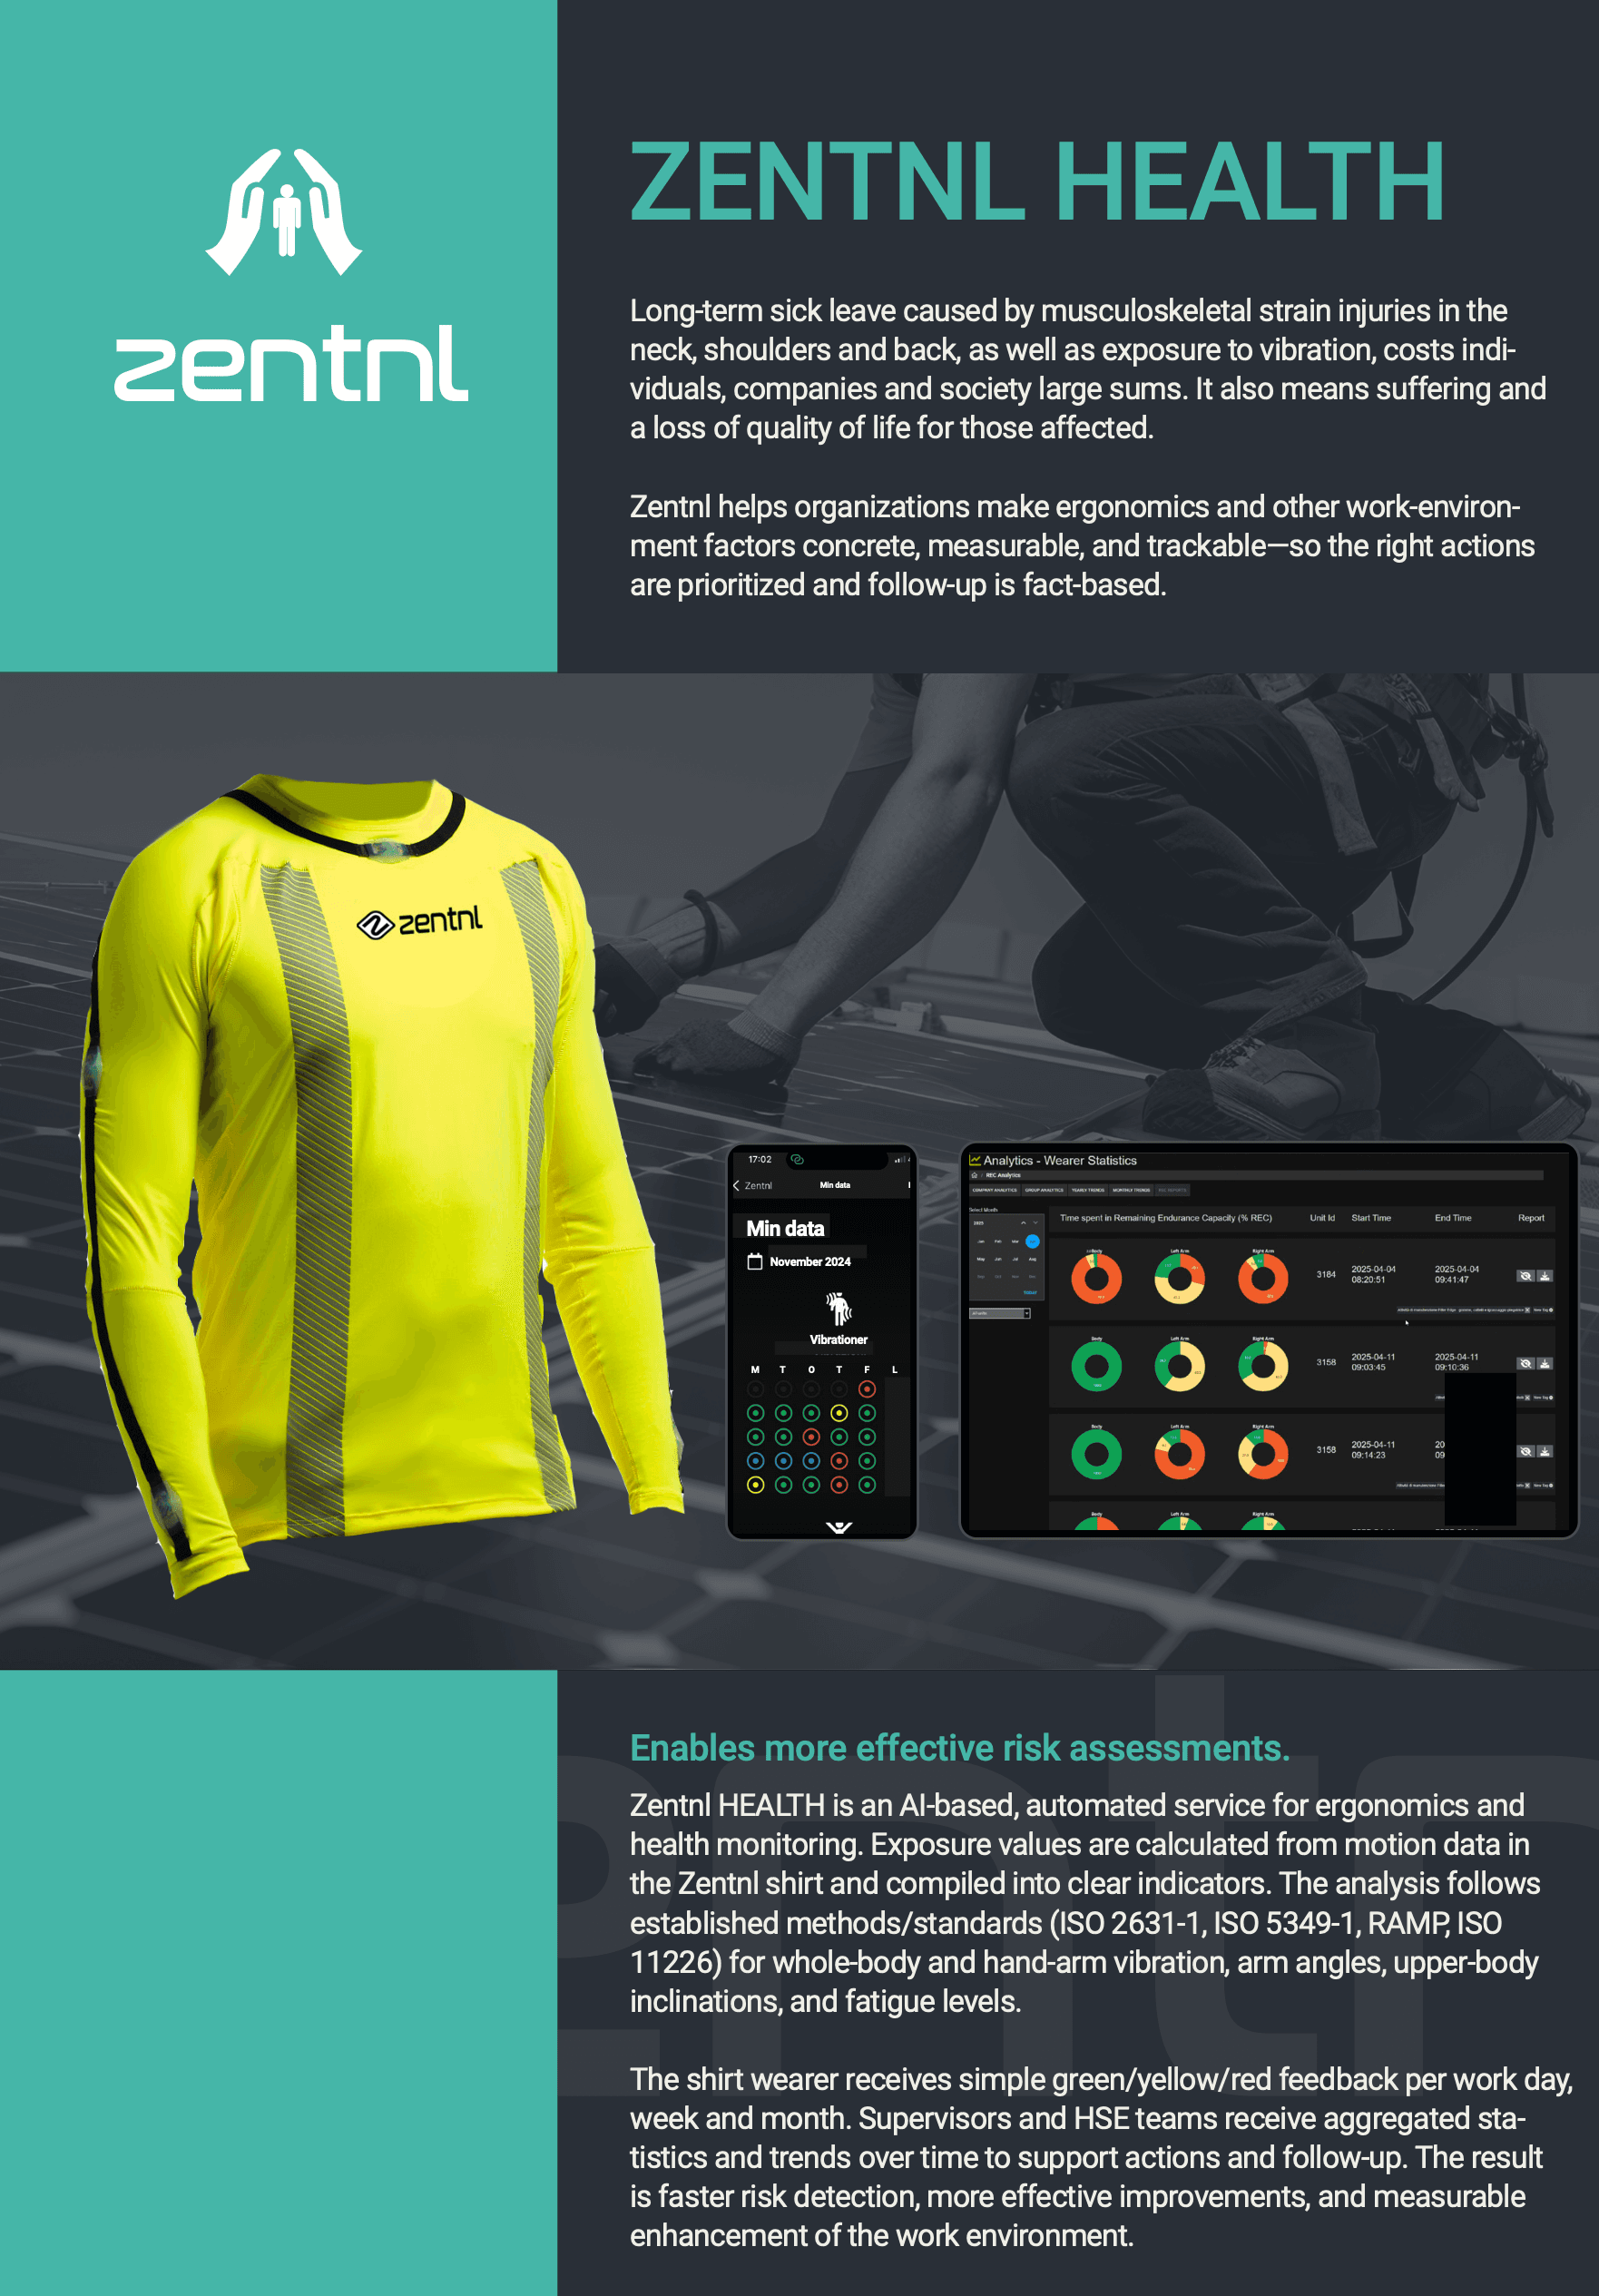
Zentnl is a solution that enables data-driven ergonomics management by continuously collecting objective measurement data in real work tasks and making it useful for decision-making. The core idea is that the data can be linked to the context of the work (station/task/shift and conditions) and used to prioritise actions, implement changes, and verify effects over time.
The Zentnl method is based on three simple principles:

Continuity
Context

Verification
In practice, this means that if you work with the work environment, you get a clear baseline view, concrete metrics and trends, and reports that show where and when risks arise — and whether your measures are actually delivering results.
How to use Zentnl most effectively for data-driven ergonomics management

Work with an improvement loop:
Step 1 - Segmentation:
Make the data actionable by breaking it down by station/ task, shift, weekday, pace, and product mix. Key principle: the method should primarily describe the work, not evaluate the individual.
Step 2 - Prioritisation:
Prioritise where exposure and duration are high, variation/ recovery is low, and the trend worsens under certain conditions. Build a ranked action backlog using reports and tags.
Step 3 - Baseline / current-state view:
Measure over representative periods (preferably across shifts) and establish a baseline per station/area and, where possible, per task. Use reports and information in the Zentnl Portal.
Step 4 - Action:
Implement changes in operations (for example aids, task design, rotation, training, breaks/pace). Every action should have an owner, a date, and an expected indicator improvement.
Step 5 - Verification:
Always compare before/after against the baseline and check variation (shift/pace/product mix). Present results in zones/trends/distributions that everyone can understand.
Step 6 - Continuity:
Set a routine: weekly signal monitoring, monthly prioritisation, quarterly management reporting.
Use the right report at the right time
To achieve maximum effect, you need easy access to the right decision support. In the Zentnl Portal, you can filter reports by day or month, for individuals, groups, or multiple groups, and generate reports as needed across all indicators, including exposure doses, upper body angles, arm angles, vibrations, the fatigue indicator, and alarms.

- Whole body vibrations: filtered according to ISO 2631-1
- Upper body angles and arm positions: filtered according to established guidelines (RAMP)
- Fatigue Levels via ISO 11226
- Incident Reporting (proprietary WAVR algorithm)